

Commentaries by Banor portfolio managers
Market Outlook – First Half 2026
Moderate Growth, Record Debt
In 2026, the global economy is expected to continue expanding, though at modest rates and far from the era of zero interest rates. The International Monetary Fund forecasts global GDP growth of around 3%–3.1% in 2026 (approximately 1.5% for advanced economies and just above 4% for Emerging Markets).
The real point of discontinuity, however, is the level of global public debt, now hovering around 95%–100% of global GDP—unprecedented levels in peacetime—and set to rise further in the coming years.
This implies:
- more limited fiscal space to intervene aggressively in the event of a new crisis
- greater reliance on central banks to stabilise the cycle
- increased market scrutiny of debt sustainability and fiscal discipline.
In other words, the fiscal “parachute” is thinner: future market drawdowns may be longer and less cushioned by large-scale public stimulus.
In this global environment, what can be expected in 2026?
- U.S. equities start with very high implicit expectations and reduced margins of safety
- Europe, despite competitive pressures, offers pockets of value—especially in small & mid-caps and Italian SMEs supported by the new National Strategic Fund (FNS)
- China is pushing extremely hard, though currency dynamics must be monitored carefully
- Emerging markets such as Southeast Asia, Africa, and Latin America benefit from supply-chain reshoring and realignment
- The U.S. dollar appears structurally weaker in a world where fiscal constraints return to the forefront, favouring emerging markets
- The bond market is echoing the dynamics of the 1990s, with equity markets at all-time highs and compressed credit spreads; in today’s context, financials appear more attractive than industrials, while exposure to high yield and highly levered sectors should be limited.
For global investors, the key message is shifting from a “easy beta” approach to one focused on selection, quality of invested capital, and careful attention to entry prices—capturing major trends (AI, energy transition, rearmament) while not ignoring the debt cycle and constraints on public policy.
Currency Outlook
U.S. Dollar: a less aggressive Fed combined with the so-called twin deficits (public budget deficit and trade deficit) creates a negative backdrop for the dollar, which is at risk of further weakening against the euro and Asian currencies
Euro: supported by improving trade surpluses thanks to lower energy prices compared to the 2022 peak, but held back by modest growth and political risks
Renminbi: strong-currency fundamentals (trade surplus, net creditor position) combined with a politically managed exchange rate lead to a non-linear outlook for gradual medium-term appreciation

Resilient Growth, Stretched Valuations
Valuations and Expected Returns
The U.S. equity market trades at roughly 25x earnings. Historically, from these valuation levels, the average real return of equities over the following ten years has been close to zero. This does not necessarily imply an imminent decline, but the long-term risk/return profile for the index as a whole is unappealing.
Confirming this caution, Warren Buffett—while remaining structurally optimistic about American capitalism—is holding the highest cash level ever at Berkshire Hathaway. The “cash pile” has reached a record high, signalling a scarcity of opportunities at reasonable prices.
Fiscal Policy and the Dollar
U.S. fiscal policy remains highly expansionary: the federal deficit consistently runs above 5%–6% of GDP, and the Congressional Budget Office expects deficits around or above 6% for the entire Trump presidency.
What is notable is that the U.S. is spending at such levels during a period of full employment and still-favourable financial conditions—historically seen only in recessions or wartime. This combination of:
- high deficits
- rising debt
- a monetary policy stance likely less restrictive in 2026 than in 2023–24
points to a structurally weaker dollar over the medium-term, especially relative to currencies of countries with more disciplined public accounts and/or trade surpluses.
Big Tech and the “Magnificent Seven”
The seven major American tech giants are allocating a substantial share of their cash to both structural investment (CAPEX) and ongoing operating costs (OPEX) related to AI (data centres, chips, models, talent). This compresses short-term free cash flow and Return on Capital Employed (ROCE), which is already declining. However, these investments are almost mandatory to defend technological leadership, especially against Chinese competitors.
From a portfolio perspective:
- AI remains a strategic theme
- investors should expect margin pressure and elevated volatility
- there is a concrete risk that future returns may fall short of exceptional past performance, given high multiples combined with declining returns on capital.
Artificial Intelligence: Higher Productivity, More Fragile Employment
Generative AI promises substantial productivity gains across many sectors (software, financial services, marketing, manufacturing, healthcare). Companies that adopt it quickly and effectively will see:
- lower operating costs
- automation of repetitive tasks
- ability to scale revenue with less staff.
However, this also entails:
- more layoffs or non-renewal of administrative and back-office roles
- social tensions and potential regulatory responses.
For equity markets, this means greater dispersion—rewarding companies that integrate AI effectively and penalising those that lag behind or operate in easily automated sectors without strong pricing power.
Positioning Ideas
- Tactical underweight on U.S. large-cap equities, given stretched valuations and historically modest real returns from similar P/E levels.
- Overweight on selective exposures (quality, value, certain AI enablers) rather than passive replication of the S&P 500
.png)
Defence and Infrastructure are not enough to offset all risks
In 2026, Europe is expected to grow just above 1%, with Germany slowly recovering after years of stagnation and a projected growth rate of around 1.2% annually in 2026–27.
Positive Drivers
- Structural increase in defence spending, with EU budgets rising sharply (estimated €381bn in 2025, +10% y/y)
- The German infrastructure fund and additional public investment plans supporting construction, energy, and digitalisation.
Negative Drivers
- Increasingly aggressive Chinese competition in Europe’s core sectors (automotive, machinery, chemicals, renewables)
- Structurally higher energy costs relative to the U.S. and parts of Asia.
Europe is not devoid of growth engines (defence, green transition, digitalisation), but struggles to translate them into a strong equity cycle at the index level. Value is increasingly concentrated in specific segments and individual stories rather than in broad exposure to the Euro STOXX 600, albeit starting from more attractive valuation levels.
Focus on the Italian Market
Italian SMEs remain one of the most attractive areas for long-term investors with tolerance for volatility and will continue to be so in 2026 thanks to the National Strategic Fund (FNS).
This fund of funds, promoted by the Ministry of Economy and Finance (MEF) and CDP, with an initial public allocation of around €350 million, aims to attract up to €1 billion from private investors (pension funds, asset managers, institutional investors).
From 2026 onwards, this capital flow may:
- increase liquidity and valuations of Italian small & mid-caps
- support new listings and reduce delisting risks
- reward solid business models, especially in industrial niches and high-quality export sectors.
Positioning Ideas
Overweight small & mid-caps relative to large caps because:
- they currently trade at a historical discount after years of underperformance
- they benefit directly and indirectly from growth in defence, energy transition, and digitalisation
- they are more exposed to domestic markets and less vulnerable to tariffs and currency swings

Excess Capacity, Deflation, and Industrial Pressure on Europe
China is aggressively expanding advanced manufacturing and R&D, creating significant overcapacity in sectors such as electric vehicles, batteries, solar, and other “green” technologies.
This results in:
- goods deflation exported to the rest of the world
- immense competitive pressure on European and, to a lesser extent, U.S. industries.
For Europe, the risk resembles a new “China shock”, which:
- erodes market share for manufacturing firms
- compresses margins
- makes tariffs and trade defence measures politically sensitive.
China is currently allowing its currency to weaken as needed to support exports and growth, but persistent surpluses and domestic deflation may eventually favour a gradual renminbi appreciation against currencies of chronically deficit-ridden countries—particularly the fiscally expansionary U.S. dollar. The timing, however, remains highly uncertain due to strong administrative control over the exchange rate.

The Credit Story in an Era of Expensive Equities
Recent months have seen a somewhat unusual combination, reminiscent of the late 1990s during the TMT bubble (Technology, Media & Telecom):
- equity indices at elevated valuations
- credit spreads—especially investment grade—near decade lows (around 100 bps over euro government bonds, levels seen only a few times outside the early 2000s).
Four historical lessons emerge.
Lesson 1. Bubbles form when spreads are widening, not tightening
From 1997 to 2000:
- credit spreads began widening as early as 1997, accelerating in 1998–99 (Asian/Russian crises, LTCM)
- telecom stocks kept reaching new highs until March 2000.
Corporate Spread vs. the telecom bubble
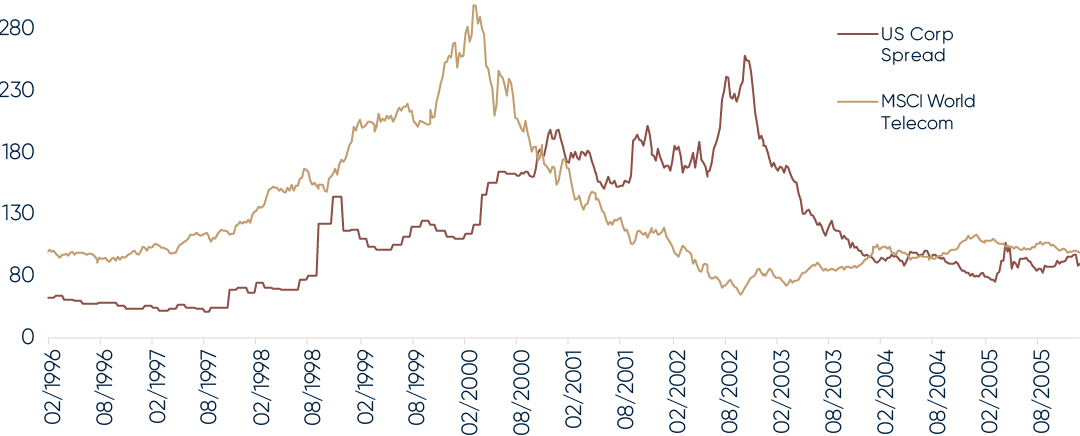
Source: Bloomberg, data analysed by Banor
In other words, the bubble inflated during three years of widening spreads—not tightening. Equity markets largely ignored the credit signal (“extracting value from increasing leverage”, as was said at the time).
This yields clear operational implications:
- further equity highs do not require spread compression—history shows the opposite can occur
- bond investors must focus less on equity levels and more on credit quality, leverage trends, and primary market dynamics.
Lesson 2. The Hyperscalers of Today Mirror the Telecoms of the Late ’90s—Spreads rose because of leverage, not defaults
The true parallel today is not the unprofitable Nasdaq of 2000, but the highly profitable telecom companies of the late 1990s that:
- had strong cash flows and initially moderate leverage
- embarked on massive re-leveraging to finance new infrastructure (fibre networks, internet backbone, 3G licenses)
- spent over $500bn in the U.S. and Europe over five years—mostly financed with debt.
Spread widening in the late 1990s was driven by:
- an explosion of debt issuance (record high yield and investment-grade supply, heavy share of B-rated debt)
- investors demanding higher risk premiums to absorb the volume.
Defaults rose only after the bubble burst (2001–02), when spreads were already wide.
Today we see a partial echo:
- AI/cloud hyperscalers are highly profitable but undergoing extraordinary CAPEX cycles
- an increasing share of funding comes from bond markets, with large investment-grade issuances in both USD and EUR.
The parallel has limits: these investments are currently financed only marginally through debt and are largely covered by earnings.
Over the next six months this suggests:
- the medium-term driver of spreads is the pace of gross issuance and market absorption capacity, rather than the default rate
- if the AI/cloud investment cycle continues unabated, a steepening of the corporate spread curve and gradual widening of industrial spreads is likely—even without immediate systemic stress.
Lesson 3. After the Bubble, Financials Outperformed
(Especially Subordinated Debt)
Post-2000, bank credit quality remained strong: banks had solid regulatory capital and limited exposure to speculative themes. Following the bubble burst, financial bonds—especially subordinated—outperformed many industrial corporate issues.
Today the analogy is clear:
- European banks enter 2025 with very low NPLs, CET1 levels well above requirements, and controlled risk
- stress tests show that expected credit losses can be absorbed through pre-provision profit
- banks have limited exposure to stressed credit segments (private financing, loans to unprofitable tech firms).
European Corporate Indices
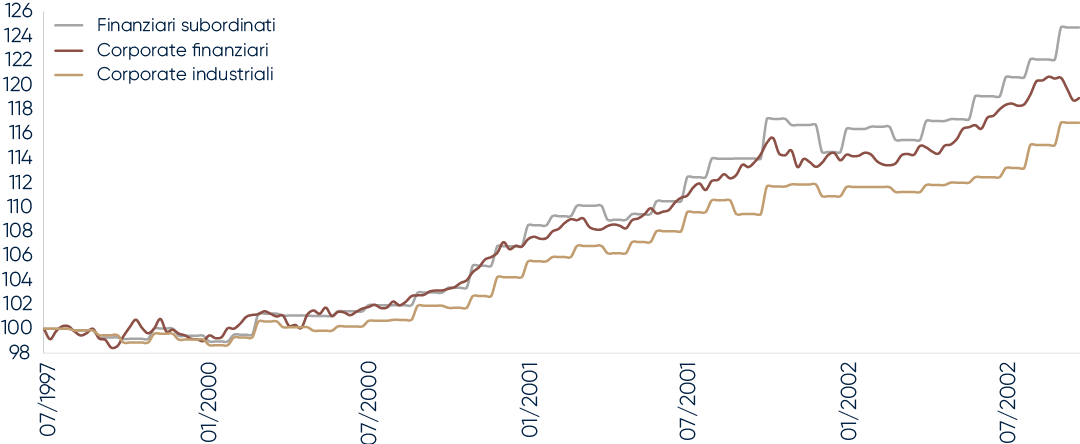
Source: Bloomberg, data analysed by Banor
Thus, a constructive view emerges for the coming months. As industrials gradually re-lever to finance structural transformations (AI, decarbonisation, defence, reshoring), banks appear the “cleanest” part of the credit market.
European subordinated financials combine:
- stronger fundamentals than pre–Global Financial Crisis (capital, liquidity, NPLs)
- regulation that reduces the likelihood of excessive leverage
- still meaningful extra spread over senior and corporate investment grade that compensates structural risk.
Lesson 4. Tight Bank Spreads Do Not Mean the Rally Is Over—The Pre-GFC Parallel
Today’s credit spreads are among the lowest of the decade. Many European investment-grade segments trade around 100bps over government bonds—tight in recent historical terms.
Before the Global Financial Crisis, bank spreads—especially among core issuers—were even tighter. The business model is evolving into one increasingly “utility-like” and heavily regulated, with limited incremental leverage and strong capital/liquidity oversight.
In such a regime:
- banks behave more like regulated utilities
- are less exposed to aggressive leverage cycles
- undergo constant stress testing and stringent prudential requirements
Further spread compression—even in subordinated paper—would not be irrational.
AT1 CoCos, the highest-spread and most volatile instruments, have historically traded at materially tighter spreads (though under a different legal regime—Basel II).
Tier 1 bond Spreads
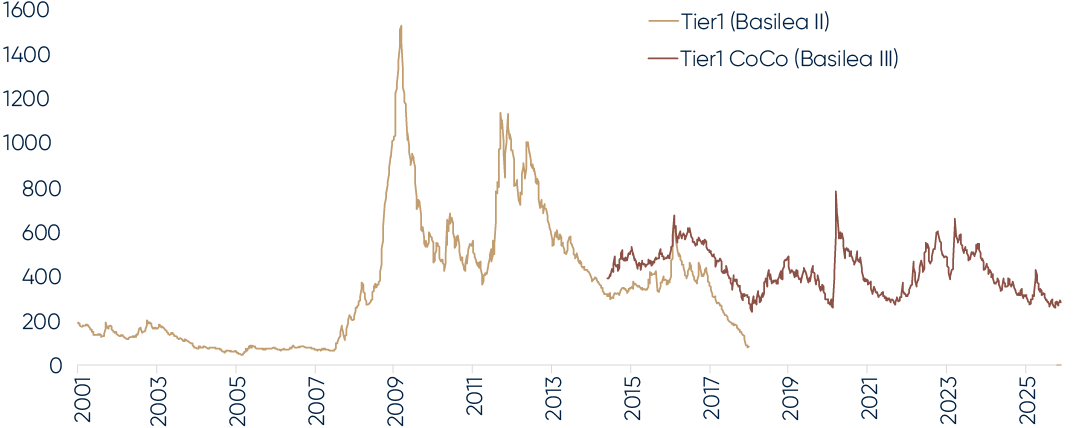
Source: Bloomberg, data analysed by Banor
In the short-term (next 6 months):
- subordinated financials still offer attractive carry
- the main risks are political/regulatory shocks or idiosyncratic events, not systemic deterioration.
Conclusion
Many past dynamics are reappearing:
- in the late 1990s, the TMT bubble inflated for years while spreads widened
- the real fault line lay in re-leveraging the “infrastructure of the future” (then telecoms, today AI/cloud)
- those who built the networks were not necessarily those who earned the final profits
- post-bubble, financial credit—especially subordinated—delivered the best relative performance.
A bond strategy consistent with these lessons remains appropriate for the next six months.
Positioning Ideas
- Overweight financials versus industrials.
- Underweight high yield and highly levered sectors.
- Use subordinated financials as a source of carry within a framework of strengthened fundamentals.

Different Speeds, Different Cultures
2025 proved a challenging transition year for discretionary spending, with the first six months marked by political uncertainty in the U.S. Volatility tied to Donald Trump’s return and his stance on trade policy weighed on consumer confidence, which—according to the University of Michigan—remained stubbornly below 70, well under pre-pandemic levels.
The Apparel & Footwear segment was among the hardest hit, due to heavy production exposure to Asian countries such as Vietnam and Cambodia, following steep tariff tightening that dampened demand and intensified promotional pressure. In the second half of the year, conditions improved: core inflation fell below 3%, real wages turned positive, and political narratives stabilised. Consumer confidence improved, with a greater focus on quality and more optimistic expectations for 2026.
Looking Ahead
2025 ended with encouraging signs for the Apparel & Footwear sector, which is benefiting from structural trends more resilient than short-term volatility.
According to Euromonitor, the global apparel and footwear market—now worth about $1.8 trillion—is expected to grow at 5%–6% annually through 2030, driven by the expansion of the Asian middle class and the rising penetration of athleisure, which now represents over 30% of total apparel consumption in the U.S.
Demographic dynamics strengthen the picture: Millennials and Gen Z are allocating an increasing share of discretionary budgets to wellbeing, performance, and lifestyle-related products. More than 60% of respondents in a McKinsey survey say they intend to spend the same or more in 2026 on premium or technical categories. This cultural shift towards quality, comfort, and brand identity suggests a favourable environment for the sector in the new year.
A Multi-Speed Sector
A look at the performance of individual companies in the Apparel & Footwear space reveals a dynamic landscape: major incumbents are navigating complex repositioning cycles; agile, highly innovative newcomers are gaining market share, reshaping competitive boundaries.
Major Players
The Nike Case
Although Nike remains one of the world’s strongest brands, it enters 2026 with much to prove. Direct-to-consumer (DTC) sales, initially rewarded during COVID, proved counterproductive in the medium-term as physical shopping returned: major retailers such as Foot Locker and Dick’s saw less Nike product and fewer refreshed assortments.
The result was a loss of brand heat just as new challengers gained momentum. CEO, Elliott Hill, will need to rebuild wholesale relationships, accelerate innovation, and bring freshness back to the product offering.
The Adidas Case
Adidas enters 2026 with solid momentum. In 2025 the brand returned to growth thanks to the strength of its “legacy” styles—Samba, Gazelle, Campus—which became global phenomena and revitalised the company’s image among Gen Z and Millennials. If 2025 was the year of rebuilding, 2026 may be the year of consolidation.
Newcomers
The On and Hoka Case
On and Hoka were among the most explosive stories in 2025 within Apparel & Footwear—true exceptions in a slowing market.
On is now ubiquitous in major cities, in some European neighbourhoods even surpassing Nike in street presence.
Hoka transformed itself from a hardcore runner brand into a mainstream phenomenon: its max-cushioning models have become symbols of modern urban comfort, embraced by young professionals and avid walkers.
A key element behind their success was the slowdown of Nike and, earlier, Adidas: the big incumbents’ shift toward DTC left gaps on wholesale shelves, gaps that On and Hoka filled with surprising ease. Their model mixes authentic innovation, active communities, and positioning aligned with three global megatrends: wellness, performance, and comfort. They enter 2026 with strong momentum, clean inventories, and vibrant demand. The real challenge? Scaling without losing identity and maintaining desirability without saturating their flagship models.
The Golden Goose Case
Golden Goose remains one of the most distinctive and fascinating stories in the sector, with a model that challenges traditional luxury rules. The brand draws strength from its iconic Superstar—an artisanal, exclusive design with instantly recognisable stylistic identity.
Unlike sports brands, Golden Goose competes not on performance but on culture: value lies in storytelling, personalisation, and the ability to turn each pair of shoes into a “lived-in” object—imperfect but, for that very reason, unique. A distinctive element is the success of its co-creation labs, offering immersive experiences that drive some of the highest loyalty levels in the segment. Combined with a less cyclical customer base, the brand is more resilient to discretionary spending fluctuations. Entering 2026, Golden Goose has strong momentum and a clear proposition: contemporary luxury, a strong community, and an identity few competitors can emulate.
Key Factors to Monitor
- China: major catalyst (or drag)
China accounts for around 18% of the global premium market. In 2025, fashion sector growth in major cities was just +2%. A return to +6%–7% would immediately benefit international brands; a weak recovery would keep the sector on a more cautious trajectory.
- The new geography of the supply chain
Over 55% of global footwear is produced across Vietnam, China, and Indonesia. In 2026, the pace of diversification toward India, Mexico, and North Africa will be crucial: even a 5%–10% shift can materially reduce tariff risk and improve lead times.
- Wholesale 2.0 and the DTC rethink
DTC offers higher margins but exposes brands to greater risk when volumes slow: higher fixed costs, more inventory, and heavier promotional pressure. Tariff uncertainty adds further complexity: with consumer confidence still below historical averages, passing cost increases onto buyers becomes harder. As a result, 2026 will be the year of rebalancing, with wholesale offering resilience and posting +8% sell-through in 2025 for many challenger brands.
- More demanding consumers, less loyal
Loyalty is declining: in 2025 only 34% of consumers repurchased from the same sports brand (vs 45% in 2019). In 2026, brands with authentic storytelling, strong perceived quality, and products aligned with key trends—wellness, comfort, identity—will be best positioned.
Conclusion
Overall, the Apparel & Footwear sector enters 2026 with significantly more favourable prospects than the previous year. Normalising inflation, a less unstable political backdrop, and more manageable comparison bases should support a gradual improvement in demand. It is also difficult to imagine uncertainty levels comparable to 2025, particularly concerning tariffs and consumer confidence.
In a more predictable environment, brands with clear identity and distinctive positioning will be best equipped to stand out.
Thus, 2026 begins with a more balanced sector and meaningful upside potential, where the ability to select the most solid and culturally relevant brands will be key to capturing the opportunities of the new cycle.
The information and opinions contained herein do not constitute an invitation to conclude a contract for the provision of investment services, nor a personalised recommendation, are not contractual in nature, they are not drafted in accordance with a legislative provision and are not sufficient to make an investment decision. The information and data are believed to be correct, complete and accurate. However, Banor does not release representations or warranties, express or implied, as to the accuracy, completeness or correctness of the data and information and, where these have been processed or are derived from third parties, assume no liability for the accuracy, completeness, correctness or adequacy of such data and information, although it uses sources that it believes to be reliable. The data, information and opinions, unless otherwise indicated, are to be considered updated at the date of writing, and may be subject to change without notice or subsequent communication. Any citations, summaries or reproductions of information, data and opinions provided herein by Banor must not alter their original meaning, may not be used for commercial purposes and must cite the source (Banor SIM S.p.A.) and the website web www.banor.it. The quotation, reproduction and in any case the use of data and information from third-party sources must take place, if permitted, in full compliance with the rights of the relevant owners.
Banor SIM S.p.A., with registered office at Via Dante 15 – 20123 Milan, registered in the Milan Companies Register no. 06130120154 – R.E.A. no. 1073114. Authorized by Consob resolution no. 11761 of 22/12/1998. Enrolled in the Register of Italian Investment Firms (SIM) at no. 31 and member of the National Compensation Fund (Fondo Nazionale di Garanzia).